LangWatch's Claude Code Usage Tracker: A First Look at Tracing Your Coding Agent's Token Spend
By Day Zero Guides Editorial · How we produce guides
Some links in this guide are affiliate links. If you sign up through them, Day Zero Guides may earn a commission at no extra cost to you. This never affects which products we cover or what we say about them. See our affiliate disclosure for details.
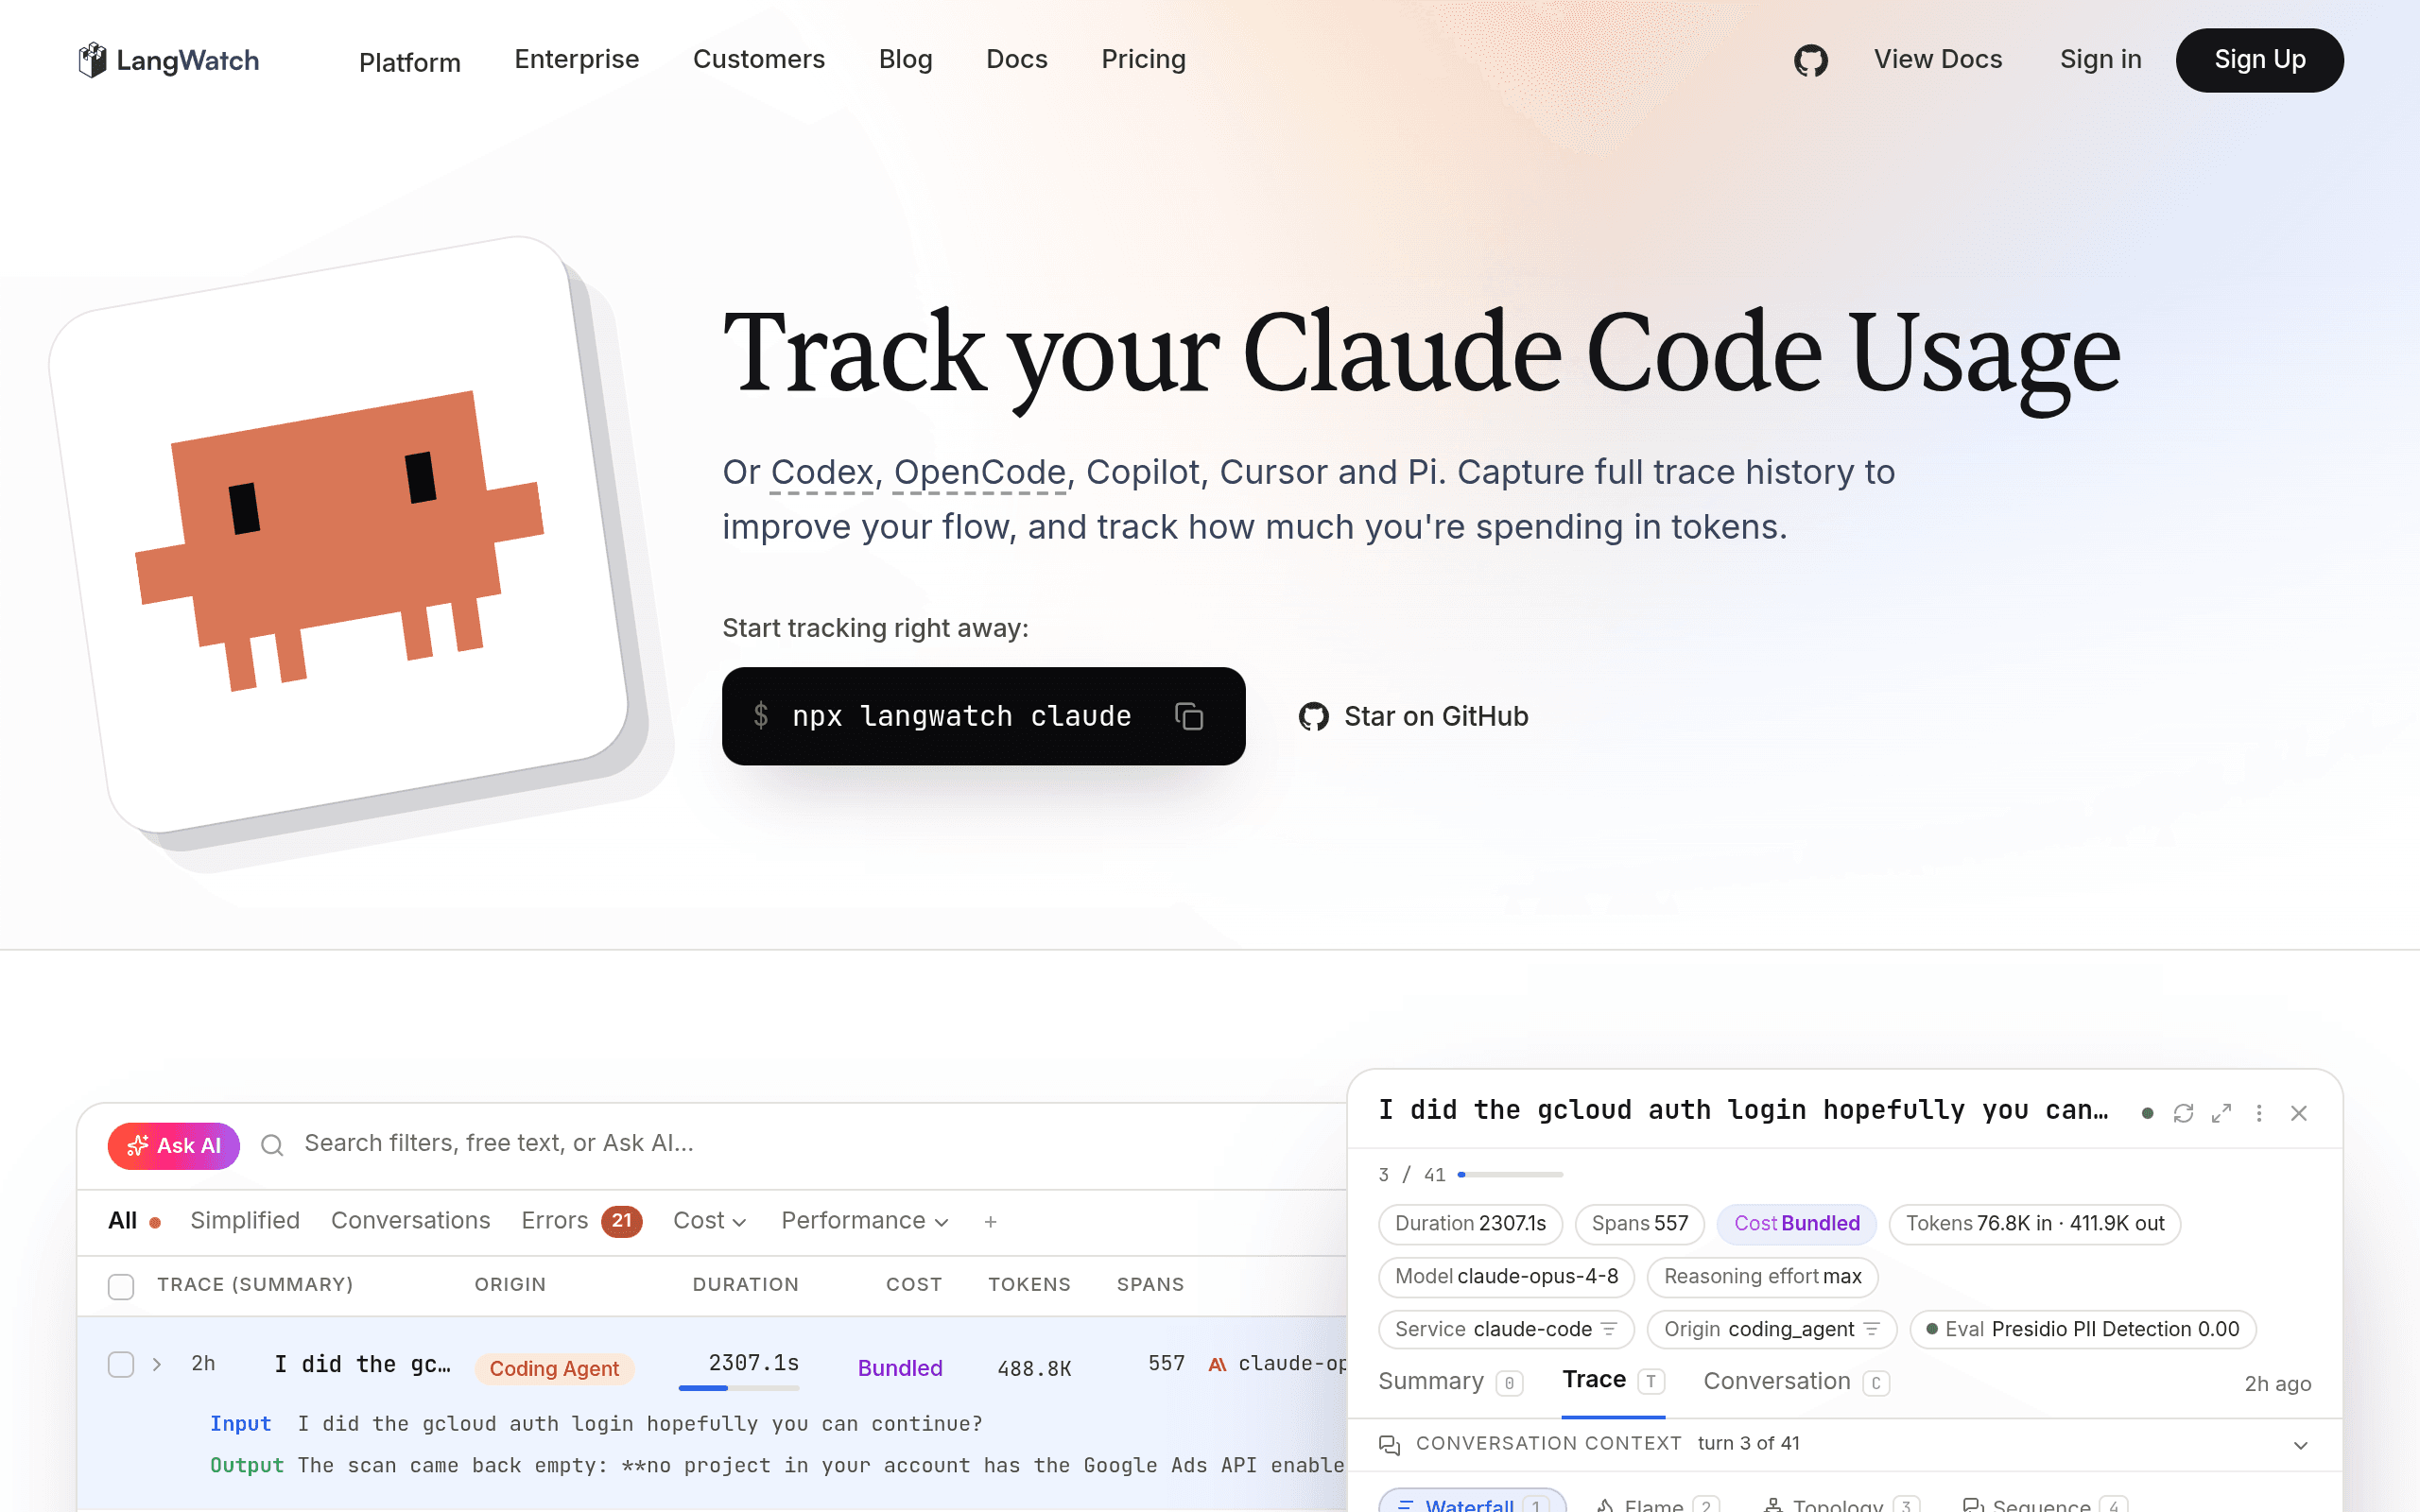
What LangWatch's Claude Code usage tracking actually is
LangWatch, an LLM observability platform that already tracks traces, evals, and costs for production AI applications, has extended that same tracing infrastructure to Claude Code (and other coding agents). Instead of building a new coding assistant, LangWatch built a layer that sits alongside the agent you already use and answers a question most teams currently can't: where exactly is our Claude Code spend going, and why did this session cost 40x more than that one?
The tool has two surfaces:
- A CLI that wraps or hooks into your Claude Code sessions and captures full trace history — every tool call, every file read, every prompt/response pair, and the token count and dollar cost attached to each step.
- A dashboard where those traces get aggregated into per-session, per-repo, and per-developer views, so you can see cost and performance trends instead of scrolling through raw logs.
This is not a replacement for Claude Code, Cursor, or Copilot. It's an accountability and debugging layer for teams that have already standardized on a coding agent and now need to answer cost and performance questions that the agent's native UI doesn't surface in enough detail.
Why this matters right now
Anyone running Claude Code across a team of more than two or three engineers already knows the problem: Anthropic's own usage numbers tell you total spend, but not which session, which repo, or which prompt pattern burned through the budget. When a single agentic loop goes sideways — re-reading the same 4,000-line file 30 times, or retrying a failing test in a loop — you find out from the invoice, not from a trace. LangWatch's pitch is that you should be able to find out from a trace.
Concrete use cases
- Catching runaway agent loops before the invoice arrives. If a Claude Code session gets stuck retrying a tool call, the trace view shows the repeated calls and their cumulative token cost in real time rather than after the billing cycle closes.
- Per-developer cost accountability. Engineering managers can see that one developer's Claude Code usage costs 5x the team average and drill into why — larger context windows, more agentic multi-step tasks, or inefficient prompting.
- Comparing agent efficiency across tools. Teams piloting Claude Code against Cursor or Copilot for the same type of task (say, a migration script) can use trace data to argue for or against standardizing on one tool, based on actual token-to-output ratios rather than anecdote.
- Debugging slow or expensive agent runs. The trace history shows latency per step, not just total spend, which helps separate "this task is expensive because it's genuinely hard" from "this task is expensive because the agent is doing something dumb."
- Finance and procurement reporting. Dashboards give a non-engineering stakeholder a way to see monthly Claude Code spend trends without needing to parse Anthropic's raw billing export.
Setup, in practice
Getting a first trace requires wiring the LangWatch CLI into your Claude Code workflow — this is a hooks-based integration rather than a fork or wrapper you run instead of Claude Code, so your existing workflow doesn't change. Once traces start flowing, the dashboard populates with session-level breakdowns. Teams already using LangWatch for LLM app observability will recognize the trace UI; this is the same tracing engine pointed at a new kind of agent (a coding agent instead of a customer-facing chatbot).
Pricing: the honest answer
LangWatch has not published specific pricing for the Claude Code usage tracking feature at the time of this writing. LangWatch's core observability platform has historically used a freemium model with a free tier for smaller trace volumes and paid tiers that scale with trace/event volume, but whether Claude Code tracking rides on the same metering or ships as a separate line item isn't stated on the product page. If cost is a deciding factor for your team, the realistic move today is to sign up, get a trace volume estimate from a week of real usage, and ask LangWatch directly for a quote before committing — don't assume it's free just because a price isn't listed.
How it compares
It's worth being upfront: Cursor, GitHub Copilot, and OpenAI Codex aren't usage-tracking tools — they're coding agents. LangWatch doesn't compete with them; it instruments them (or, in Claude Code's case, the agent it's built around). The comparison below is about where you'd actually get cost and performance visibility from each option today.
| LangWatch (Claude Code tracking) | Cursor | GitHub Copilot | OpenAI Codex | |
|---|---|---|---|---|
| What it is | Observability/trace layer on top of Claude Code and other agents | AI-native code editor with built-in agent | AI pair programmer plugin/agent, IDE-integrated | OpenAI's coding agent (CLI/cloud) |
| Price | Not published; likely tied to LangWatch's existing usage-based tiers | From $20/user/month (Pro), usage-based add-ons for extra fast requests | From $10/user/month (Individual), $19/user/month (Business) | Usage-billed via OpenAI API/ChatGPT plans; no flat "Codex" seat price |
| Usage visibility | Full trace history: per-step tokens, cost, latency, tool calls | Basic usage dashboard (requests used, plan limits) | Limited: suggestion acceptance stats, no per-task cost breakdown | Token/cost visible via OpenAI usage dashboard, not per-agent-step |
| Best for | Teams needing to debug why an agent session was expensive or slow | Individual devs wanting an agent-native editor experience | Teams already standardized on GitHub/VS Code wanting lightweight completion + chat | Developers already inside the OpenAI ecosystem running Codex CLI tasks |
| Depth of trace data | Step-by-step, exportable, dashboarded | None beyond request counts | None beyond acceptance rate | Aggregate token usage only |
Should you try it today
If your team runs Claude Code for anything beyond occasional autocomplete — multi-step agentic tasks, repo-wide refactors, CI-triggered agent runs — and you've ever been surprised by a bill or unable to explain a slow session to a stakeholder, this is worth wiring up this week. It costs you an integration afternoon to find out if the trace data changes how you manage agent spend. The one real caveat: with pricing unpublished, don't roll this out to a 50-person engineering org before confirming what a month of trace volume will actually cost you. Start with one team or one repo, look at a week of trace data, and get a quote before going wider.
If you're not running Claude Code at all — if your team is on Cursor or Copilot exclusively — this specific product isn't for you yet, though it's a reasonable signal that similar tracking for other agents may follow.